RSS aggregators are typically used as a means of efficiently gathering and browsing large amounts of information. this works well for sites that regularily update or change their content. however, the scalability of this tool is rapidly challenged when a person attempts to monitor more than a few dozen sites using the approach offered by first generation RSS aggregators.
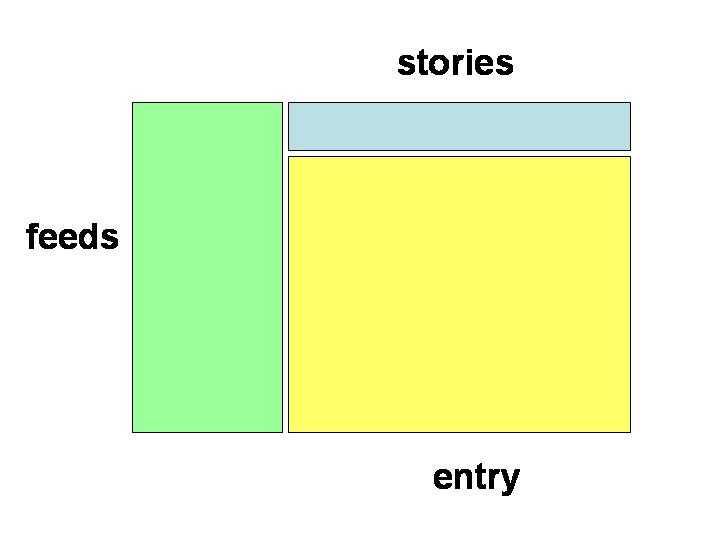
a typical RSS aggregator has a layout similar to a usenet reader or a mail user agent. in this model, a 3 paned layout is used, with navigation typically going from the list of feeds (panel 1) to the list of headlines for the current feed (panel 2) to the extracted content for a particular title (panel 3). new articles are typically indicated by highlighting the feed and headline. this is illustrated in the figure below.
layout of the UI of a typical RSS aggregator application. the feeds list is often on the lefthand side, but sometimes on the top. the stories within any single feed are usually listed in a window above the individual entry being viewed.
the main goal of the use of an RSS reader is to automatically gather content from dynamic sites and highlight new material. while this works well for a small number of RSS feeds, this usage model quickly breaks down when the number of feeds grows to several dozen or even hundreds. under these circumstances, the stream of new content is transformed into a flood of material, and the aggregator tool has only automated the gathering of more material to read. because an RSS reader gathers material that the user requests, it is reasonable to assume that they will possibly want to examine all of it. however, a typical human reaction under the circumstances of information overload is to begain triaging material by discarding it or by skimming it more rapidly. in both cases information is lost. furthermore, the information is usually presented without any semantic tags to indicate what material is of higher value than the other information. the user is left to make that determination on their own. finally, for feeds of a similar nature (ie news feeds of global events), a significant amount of redundancy will be observed, aggrevating the problem.
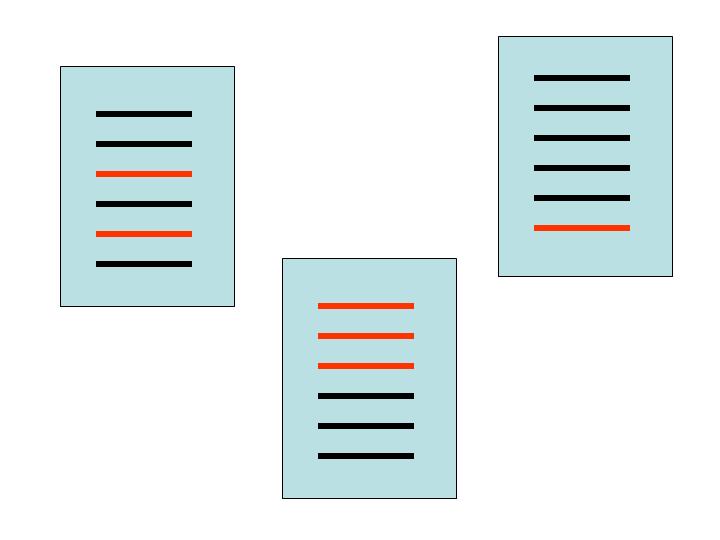
how the new stories discovered by an RSS aggregator are indicated. stories that have not yet been read are indicated in red, stories that have been read are indicated in black. individual feeds are indicated as blue boxes.
as a means of improving the scalability of the RSS aggregation approach, i have begun using an approach of doing second order analysis on the aggregated materials to make use of the redundancy in the information. i dub this technique "RSS clustering" because i group stories by topic. the redundancy observed in any collection of RSS feeds can be used for two main purposes. the first is to highlight the interesting bits of news within a pool of feeds, basing this on the assumption that the apperance of the topic in multiple entries is proportional to the importance of that topic. the second is that entries can be clustered around these topics, reducing the volume of information presented to the user at any one time.
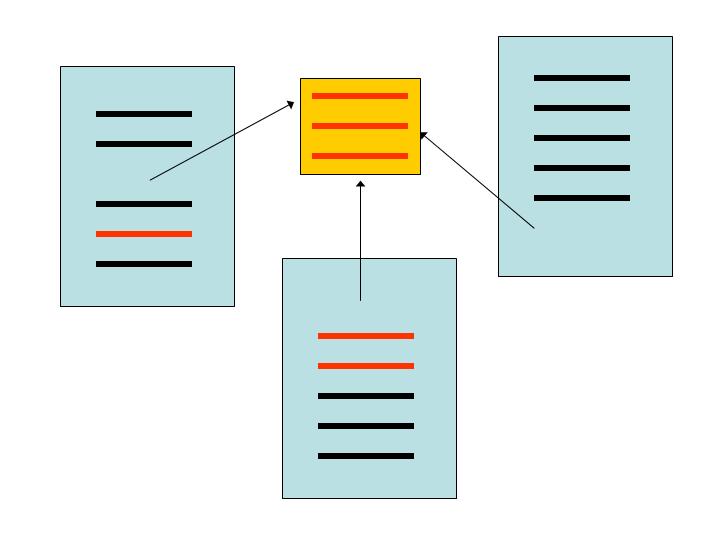
stories that are related by a common topic are grouped together to indicate their relation and streamline the RSS reading process. these stories are pulled from individual feeds.
this technique is not new or novel, and has been demonstrated by sites such as google news, topix, daypop, and to a larger extent popdex and blogdex. all of these sites aggregate dynamic content together and use a set of popularity hueristics to determine topics and content found interesting by the community at large. in the case of news sites like topix, daypop, and google news, the community is the news publication community. in the case of blogdex and popdex it is the blog publication community that collectively indicates what is interesting. this acts as a collaborative filter mechanism which can be leveraged by aggregating enough information.
additionally, the approach of topic maps has a similar approach and is much more mature. when visualized, they show the occurances on the basis of topics. this approach goes one step beyond this by actually clustering the similar occurances.
would end up looking like this:A man named Fred was stopped outside of your home today. He was walking a dog named Chief past a fire hydrant on Maple street.
additional criteria are always possible to weed out the uninteresting bits.man named fred stopped outside home today walking dog named chief past fire hydrant maple street
        man name fred stop outside home today walk dog name chief
        past fire hydrant maple street
2 name
1 walk
1 today
1 street
1 stop
1 past
1 outside
1 maple
1 man
1 hydrant
1 home
1 fred
1 fire
1 dog
1 chief
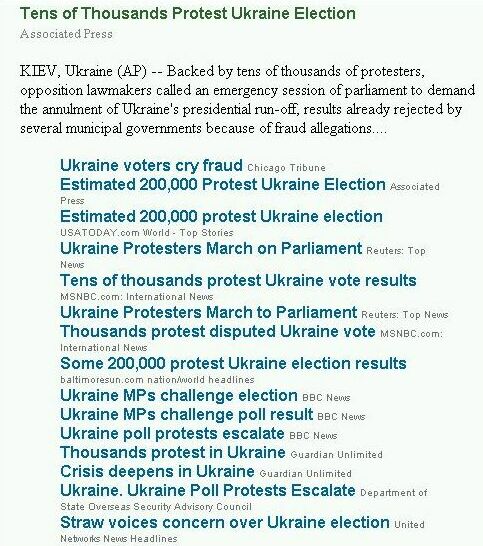
example output of RSS clustering done using the steps described above with input data from 66 sources (NYT, BBC, AP, UPI, etc). this data was gathered on 31 august 2004. the clustering output was processed using the "neato" tool from the Graphviz toolkit. headlines at the center of the cluster are the story with the most detail in the story description, not necessarily the one closest to all of the stories. use your right mouse button to get the SVG contextual menu to zoom or move the image. NOTE: if you don't see anything above, you need an SVG viewer for your platform. google for your platform, Linux/Windows/OS X are all supported by Adobe's SVG viewer.
at this point there are no metrics to evaluate the quality of the groupings. this makes it difficult to understand the impact of any intended improvements on the approach.
a more practical use of the mechanism is shown in the next two figures. these methods have been used to develop a personal news site using several dozen news feeds from around the world. because of the structure of a typical news feed, subjects are clearly indicated. a typical news headline, for example, usually includes a subject and an action, and often a geographic location. most daily newspapers follow this format for regular stories as they must clearly indicate to the reader what events are news and what they may want to read. magazines and other, less frequent sources of news often do not clearly identify the subject so clearly. these sources are difficult to use in the aggregation system without deeper analysis.
the author of this paper has been using such a system for over one and a half years to gather, distill and present world news from dozens of sources. this system, called "monkey news", is shown below. the top six topics are indicated in the header. stories are arranged in descending order from most popular to least and are gathered by topic. the system presents this information as a static HTML page updated every 2 hours.
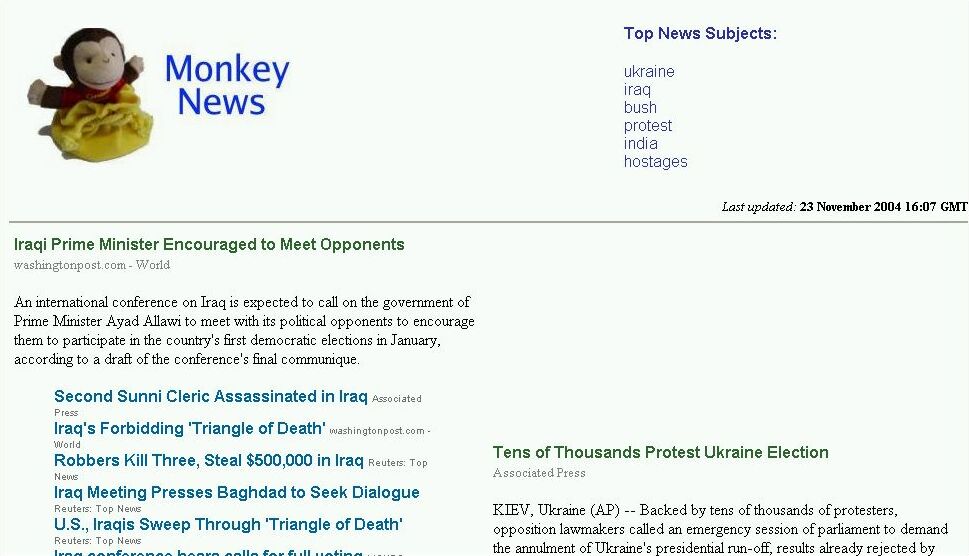
image capture of the the front page of the "monkey news" site showing the top six subjects and the first two clusters of stories grouped together by topic. stories appear in descending order of popularity as determined by topic mention from the various sites.
an individual group is shown next. the top of the grouping includes the headline, source identification, and a small paragraph describing the topic. additional sources are grouped underneath this initial story, allowing for the browsing of these stories.
screen capture of an individual story block from monkey news. the grouping is clearly identifiable based onthe topic, and the usability of a single group is evident. the top story in the group has the description of the story available, with supplemental links and sources clearly identified.
using this method, the number of news sources can be easily expanded without increasing the burden on the reader. instead, the accuracy of the groups is improved, and additional views are available. this helps prevent the explosion of stories to read before a complete picture of world events is gained when new sources are added. this data is inferred from the quantity of sources talking about a subject, which provides a "vote" to the popularity of the topic. this data is inherent in a collection of stories and feeds and does not come from external sources.
monkey news has proven to be a useful site for the author. during the 2004 presidential election, for example, the viewpoints of various news sites was constantly available. during the invasion of iraq by US-led forces, a constant stream of updates was made available also from different sources, both foreign and domestic. while this would have been available using a traditional RSS aggregator as described above, the number of stories would have been overwhelming. over 1000 stories a day are gathered, grouped, and presented using this system. while an RSS aggregator facilitates the gathering of these stories, it does not facilitate their consumption. this approach clearly reduces clutter and improves readability over a basic, flat approach. monkey news results are periodically evaluated by comparing the stories that have been identified as popular to sites such as google news, topix, and daypop. while these sites often offer more stories, the core events at the time are correctly identified by the monkey news system.
one of the primary limitations of this approach is that it requires that the sources all discuss the same topics using similar terms. for example, it would be difficult to group an article about the US presidential race if it described the race using terms from shakespeare. because no other stories would be using the same poetic approach, the true nature of the topic would be obscured in the analysis.
this leads directly into the second limitation, namely a requirement that the analysis all (or nearly all) be done in the same language. in the absence of robust machine translators, the topics sources not use the same terms to describe a topic.
a third limitation is that some threshold must be crossed for a grouping to form, meaning the number of sources required to get reasonable results scales with the diversity of topics. this is evidenced by the success of the clustering for world news based on approximately 65 feeds, while similar groupings for "memes" requires thousands of blogs and other sites to be aggregated and analyzed.
finally, this approach does not work well to detect breaking news events, since it is a second order analysis. new, breaking topics (such as fast moving weather systems, terrorist attacks, or the like) are first reported in the press and must gather enough momentum or magnitude to compete with other stories in order to become visible. in this case, the topic would become most visible when ranked by momentum (ie rising in visibility most quickly) rather than static rankings of visibility.
time resolved clustering can also be performed using techniques such as bayesian network analysis. this can be used to discover that terms are related and highlight relationships which were previously unknown.
additional time-resolved analysis that includes term analysis based on ranking over time. this can be used to evaluate the effectiveness of public relations efforts and major events such as political campaigns.
finally, clustering can be further improved by adding additional data to the system. currently the implementation only clusters based on terms that appear in the headlines. however, using the full news story body, additional contextual information can be gathered and used to produce more robust groupings.
it would be interesting to build a desktop application which acted in this fashion. the storage requirements for any single user would be minimal
copyright © 2004 jose nazario, all rights reserved.